今天调查了一个奇怪的问题,在其他日志都是看起来的情况下,突然发现某个日志在5号凌晨开始后没有被收录了。
定位问题
通过调查日志文件本身发现是有记录的,但是没有进入elk。由于前面我已经加上了日志counter和服务器id,那么可以排除日志hash碰撞的可能性。于是开始调查logstash,得到的日志结果:
[2020-01-06T05:47:02,707][WARN ][logstash.outputs.elasticsearch] Could not index event to Elasticsearch. {:status=>400, :action=>["index", {:_id=>"f5a3e882bfcb4f155c99db18c07093e2", :_index=>"kakiraid-info-2020.01.06", :_type=>"kakiraid_log", :_routing=>nil}, #LogStash::Event:0x2ccdcf00], :response=>{"index"=>{"_index"=>"kakiraid-info-2020.01.06", "_type"=>"kakiraid_log", "_id"=>"f5a3e882bfcb4f155c99db18c07093e2", "status"=>400, "error"=>{"type"=>"illegal_argument_exception", "reason"=>"Limit of total fields [1000] in index [kakiraid-info-2020.01.06] has been exceeded"}}}}
原来是索引中的字段给撑爆了。联系起前几天调整的复杂日志结构问题,是有这个可能性的。因为为了分析开卡日志和减少日志放大倍数,为每个item都动态生成了field。没想到在这里给自己挖坑了。
为了确定是不是这个原因,我们需要统计下当时的情况:
curl -s -XGET http://host:port/index/_mapping? pretty | grep '"type"' | wc -l
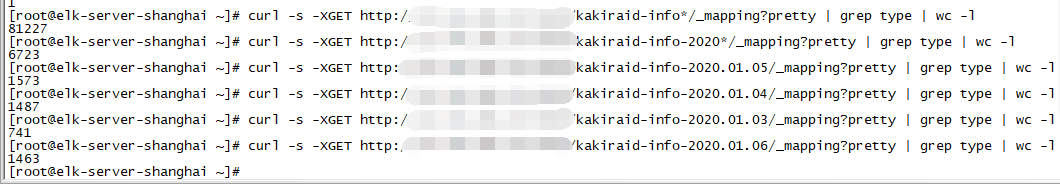
可以看到3号的field才741个,4号已经飙到1487个了,5号差不多1573个,6号是1463个。默认的field上线是1000个,怪不得会出现上面的错误,并且可以推断丢失的日志应该不止一种。只能说比较幸运的是,影响范围不大。
解决问题
好吧,调整下settings。这里最重要的就是这句"index.mapping.total_fields.limit": 2000(默认值是1000)。当然这里需要考虑下对于开卡这种日志,其实有必要让他自己单独享用一个index,来减少这种问题。
{
    "index.mapping.total_fields.limit": 2000,
}
由于一般我们会使用动态模板,这样我们每次的设置仅对当前的索引产生效果。如果第二天来的日志,还会使用默认的模板来进行索引。最好的方案是使用自定义模板:
put {{domain}}/_template/kakiraid-logs

{
  "template": "kakiraid-*",
  "order":    1,
  "settings": {
    "index.indexing.slowlog.threshold.index.debug" : "2s",
    "index.indexing.slowlog.threshold.index.info" : "5s",
    "index.indexing.slowlog.threshold.index.trace" : "500ms",
    "index.indexing.slowlog.threshold.index.warn" : "10s",
    "index.mapping.total_fields.limit": 3000,
    "index.merge.policy.max_merged_segment" : "5gb",
    "index.merge.policy.segments_per_tier" : "24",
    "index.merge.scheduler.max_merge_count" : 10,
    "index.merge.scheduler.max_thread_count" : 1,
    "index.number_of_shards": "5",
    "index.number_of_replicas" : "1",
    "index.optimize_auto_generated_id" : "true",
    "index.refresh_interval" : "60s",
    "index.routing.allocation.total_shards_per_node" : "-1",
    "index.search.slowlog.threshold.fetch.debug" : "500ms",
    "index.search.slowlog.threshold.fetch.info" : "800ms",
    "index.search.slowlog.threshold.fetch.trace" : "200ms",
    "index.search.slowlog.threshold.fetch.warn" : "1s",
    "index.search.slowlog.threshold.query.debug" : "2s",
    "index.search.slowlog.threshold.query.info" : "5s",
    "index.search.slowlog.threshold.query.trace" : "500ms",
    "index.search.slowlog.threshold.query.warn" : "10s",
    "index.translog.durability" : "async",
    "index.translog.flush_threshold_size" : "5000mb",
    "index.translog.sync_interval": "600s",
	"index.unassigned.node_left.delayed_timeout" : "7200m"
  },
  "mappings": {
    "_default_": {
	  "dynamic": true,
      "_all": {
        "enabled": false
      },
      "dynamic_templates": [
        {
          "string_template": {
            "match_mapping_type": "string",
            "match": "*",
            "mapping": {
              "type": "text",
              "fields": {
                    "keyword": {
                        "type": "keyword",
                        "ignore_above": 256
                    }
                }
            }
          }
        },
        {
          "ip": {
            "match_mapping_type": "*",
            "match": "*_ip",
            "mapping": {
              "type": "ip"
            }
          }
        },
        {
          "date": {
            "match": "*_date",
            "mapping": {
              "type": "date",
              "format": "yyyy-MM-dd HH:mm:ss"
            }
          }
        },
        {
          "keyword": {
            "match_mapping_type": "string",
            "match": "*_k",
            "mapping": {
              "type": "keyword",
              "ignore_above": 256,
              "null_value": "null"
            }
          }
        },
        {
          "long": {
            "match_mapping_type": "*",
            "match": "*_l",
            "mapping": {
              "type": "integer"
            }
          }
        },
        {
          "double": {
            "match_mapping_type": "*",
            "match": "*_d",
            "mapping": {
              "type": "double"
            }
          }
        },
        {
          "boolean": {
            "match_mapping_type": "boolean",
            "match": "*_b",
            "mapping": {
              "type": "boolean"
            }
          }
        },
        {
          "analyzer": {
            "match": "*_a",
            "mapping": {
              "type": "text",
              "index": true,
              "analyzer": "english",
              "null_value": "null"
            }
          }
        }
      ]
    }
  }
}
其他的是我为了加快索引速度给的一些“调优”。比如refresh_interval这个默认值是1s,虽然看上去日志是所见即所得,但有的时候并不需要这么快。可以适当的延长这个值,让日志在file_cache中多呆一会儿再被可见。其实对于elk来说,文档可见其实只要缓存到了file_cache中即可,并不需要写入到硬盘。
当然通过flush也是可以保证这点的,但是它的代价就是磁盘io。所以我这里将translog设定成了异步并且有大小阈值的。因为这些日志文件并不是那么的重要。
同时我还设定了dynamic_templates来保证未来的扩展性,只要符合命名规则就可以自动解析成想要的类型了。这里要注意得是模板其实也有顺序的,个人越是通用的应该要放在上面比较好。然后对于string类型来说,建议还是使用text而不是keyword,这样会使得日常查看日志方便许多。
如何重新装载日志呢?
为了保证日志的完整性,肯定是需要重新index受到影响的日志。这个结合filebeat的inode特性,我们首先需要隔离开受到“错误”影响的日志,比如某个时间段之后的日志的索引都有问题。按照我的经验是截至到当天的前一天为好。最重要的原因是当天的index还没有完成,处于正在执行状态,是不会接受已经被索引过的日志的。要么就是停止当天的索引,要么就是隔天操作。
隔离开的日志只要更换下inode,然后就可以做到不停机的情况下重新index了。比较稳妥的方案是可以删除掉已经存在Index, 然后找一个压力比较小的时候做以上的操作:)